Analytics and data

Make better decisions with the right data

Your growth depends on the quality of your insights. Multiply provides you with most important metrics for continuous revenue optimization.

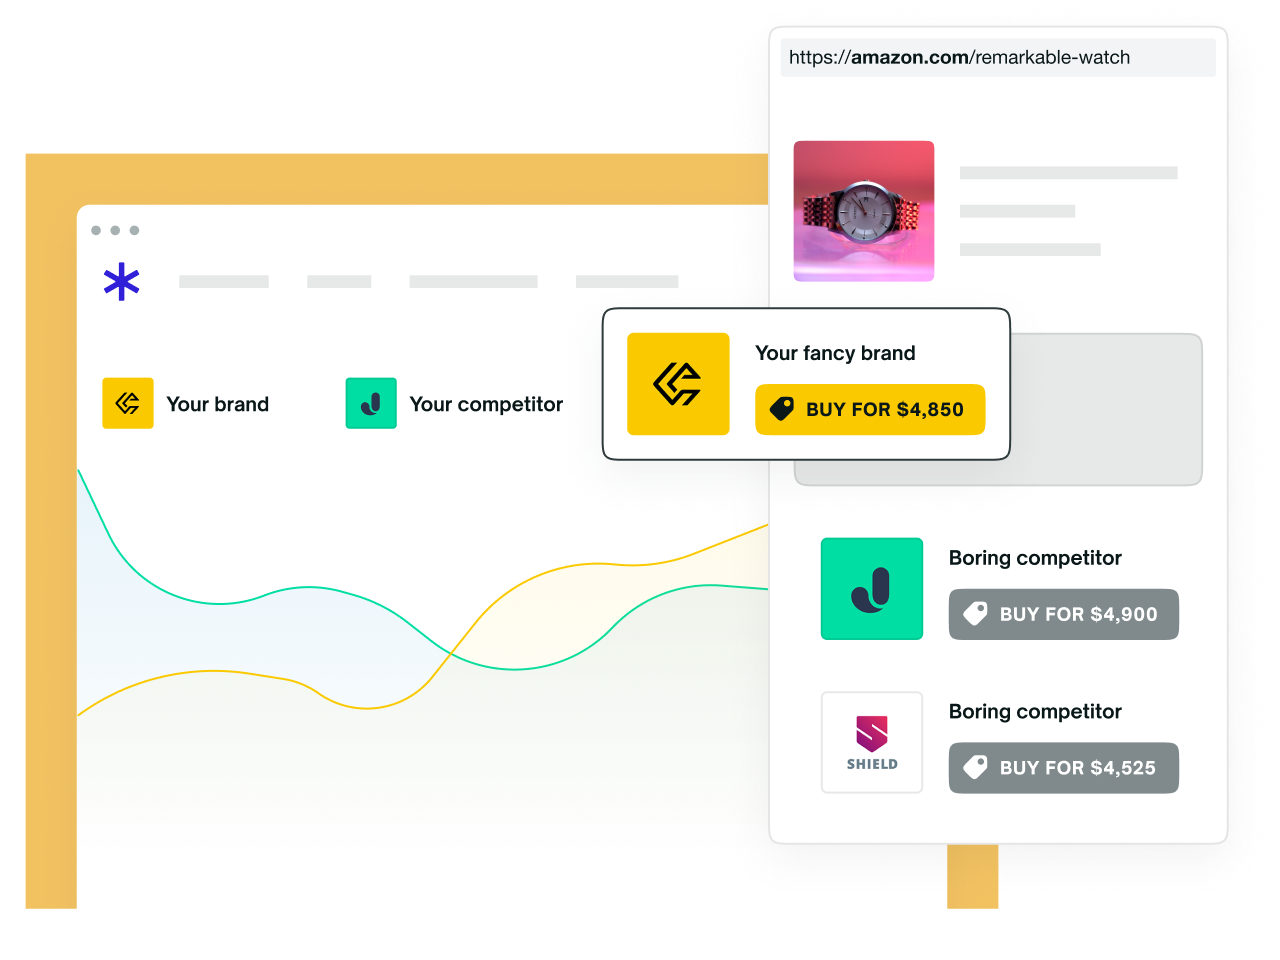
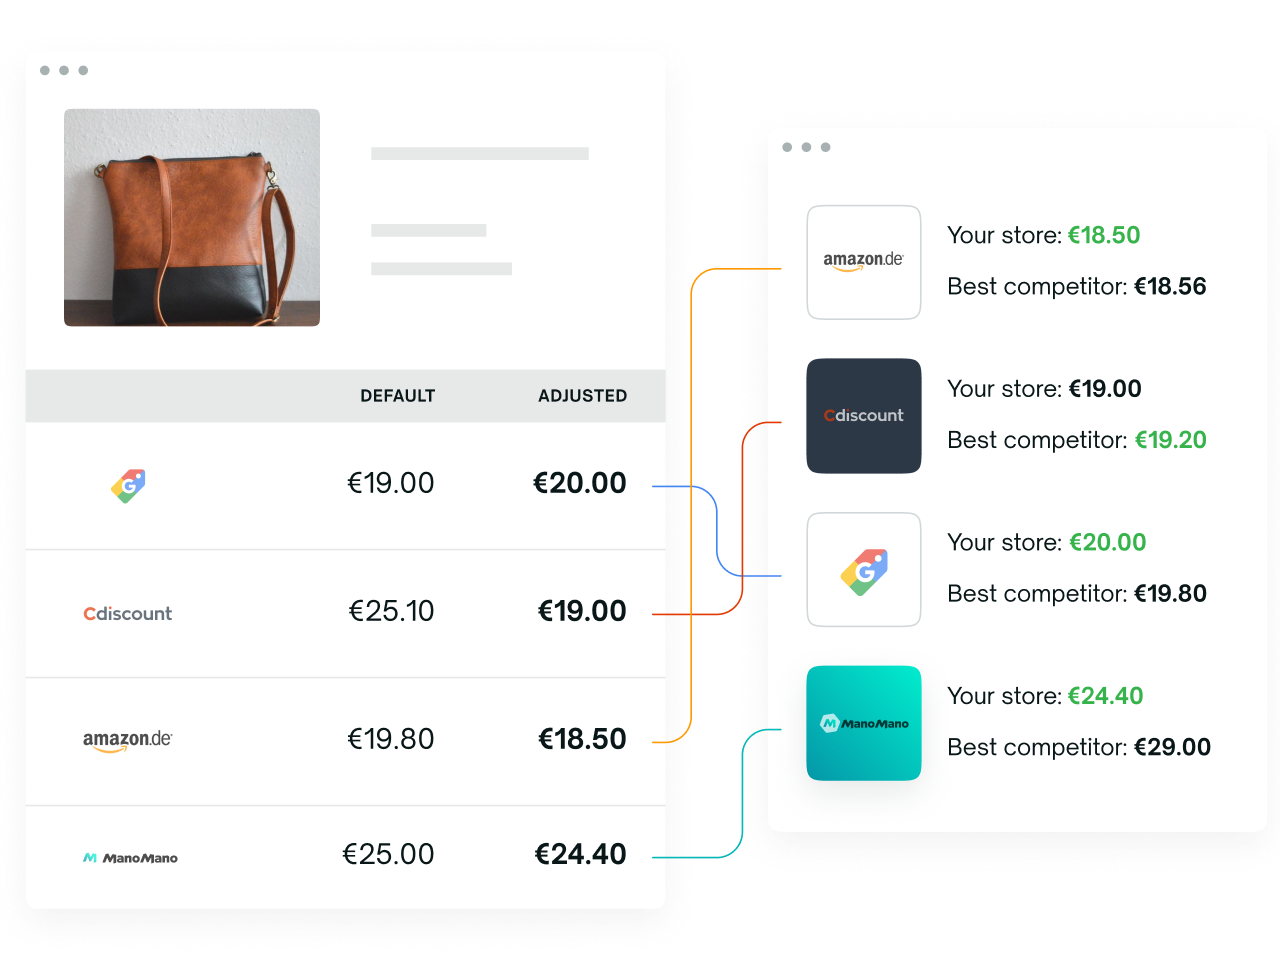
Illustrations showing graphs and charts.
Blue "Get a birds-eye overview" icon.

Get a birds-eye overview

See the big picture a glance with our performance dashboard. Discover key metrics – including net revenues per product, universal profit margins, Buy Box win rates, and more.

Orange "See real-time results" icon.

See real-time results

Observe and react to price fluctuations as they occur with real-time reports. Break it down by channel or SKU and see KPIs like sales, profit margins, Buy Box placement, and competitor activity to continually drive your business’s growth.

Grey "Spy on your competitors" icon.

Spy on your competitors

You’ll have access to unique competitor insights. Get the full record of their price adjustments, Buy Box win rate, and rating changes on the relevant channels over time. Use this data to drive smarter strategic decisions.

Green pricing trends icon.

Discover pricing trends

A comprehensive price history shows the performance of your SKUs and channels – including sales, price, profit margins, and Buy Box win rate. Identify causal patterns between these KPIs and gain a deeper insight into your market, customers, and competition.

Discover Multiply’s Full Capabilities

Become a marketplace leader
with Multiply

Start your free trial to discover the unique features that’ll help you grow your sales and revenues.

7 days ・ No payment details required